

What your restaurant really keeps from AED 100 on the delivery apps
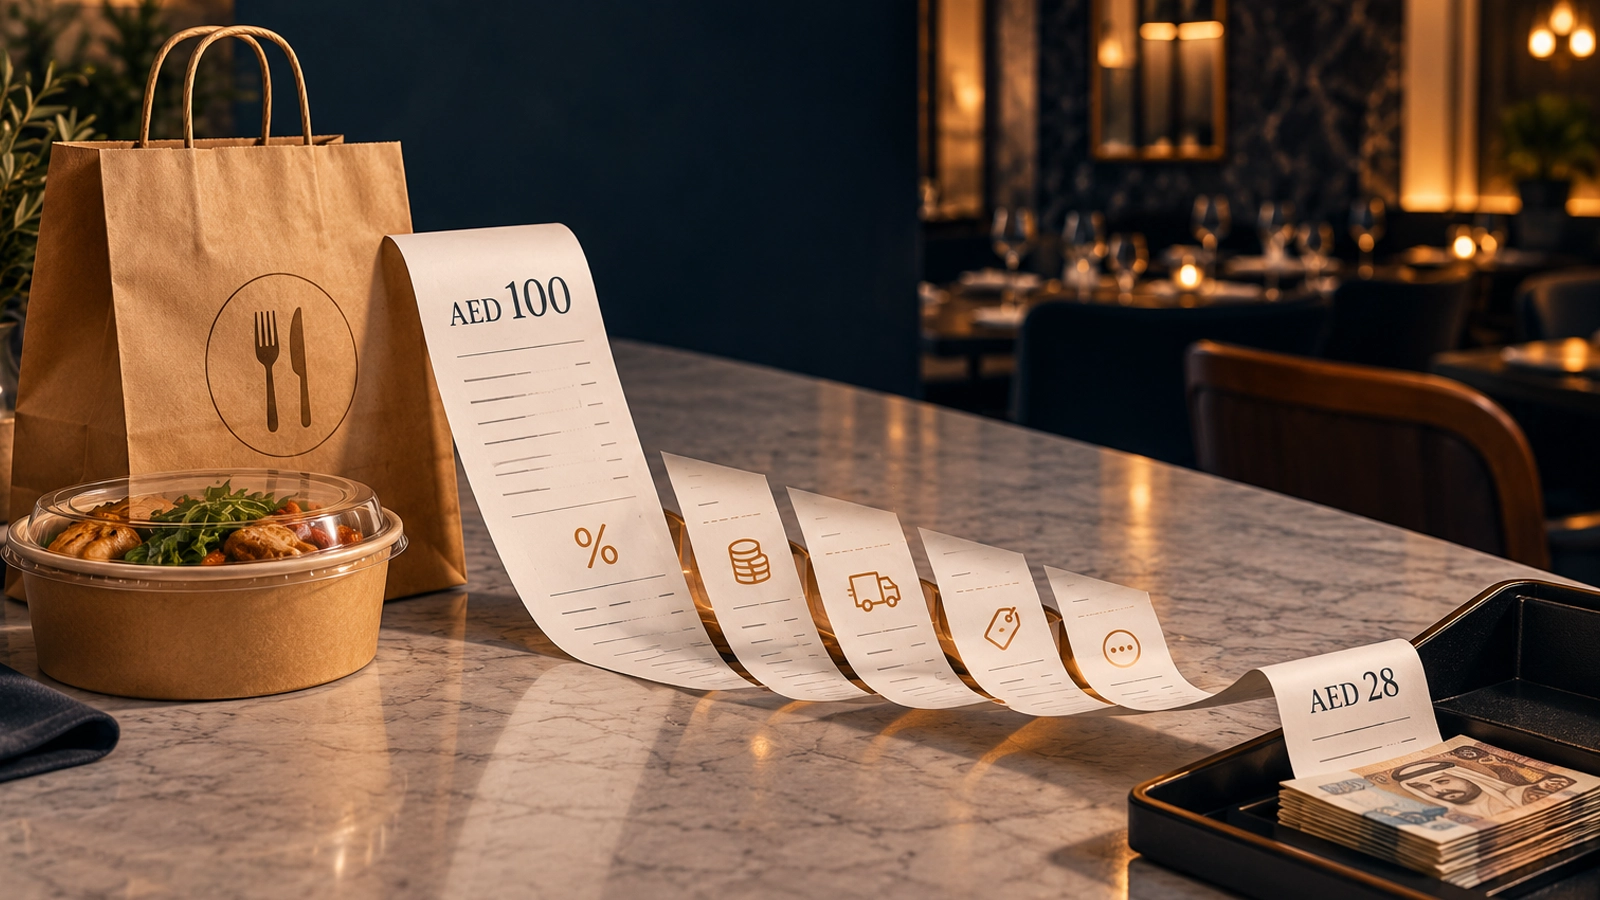
Commission is only one line. Here is the full path from a AED 100 order to the money that lands in your account, with the maths.

On this page
Most restaurant owners know their commission rate. Far fewer know what actually lands in the bank from a AED 100 order. The gap between the two is where delivery margin quietly disappears.
In the two worked examples below, the restaurant keeps AED 29 from AED 100 of menu sales with a 10% offer, and AED 12 with a 30% offer, at the same 25% commission. That is after the app, discounts, food and packaging, and before rent and salaries. Discounts and ad spend move the result more than the commission rate does.
Start with the rate, then forget it
Talabat, Deliveroo, Keeta and Noon do not publish a rate card. Rates are negotiated per restaurant, and the publicly reported range for the UAE runs from about 15% to 30% of order value, with some operators reporting higher once delivery and service fees are added (operator survey citing Khaleej Times). Two restaurants on the same street can be several points apart.
The rate matters, but it is a single line on a statement with six or seven lines. Focusing on it is like checking the price of oil and ignoring the size of the portion.
The full path from AED 100 to your bank
Here is a worked example for one order with a menu price of AED 100. The numbers are illustrative, not any one client's, but the structure is exactly how we reconcile payouts every month.
| Line | AED | What it is |
|---|---|---|
| Menu price (gross sales) | 100.00 | What the customer sees before any offer |
| Discount you fund | −10.00 | Your share of the offer. Some campaigns are co-funded by the app |
| Net sales | 90.00 | Gross minus the discount |
| Commission at 25% | −22.50 | Charged on net sales in this example. Check your contract: some apps charge on the full price |
| App marketing (CPC, ads, featured placement) | −4.00 | Spend deducted from your payout, spread per order |
| Refunds, adjustments, cancellations | −1.50 | The line most restaurants never check |
| Net payout | 62.00 | What the app actually transfers |
| Food and packaging cost | −33.00 | 30% food cost plus AED 3 of packaging |
| What you keep (CM3) | 29.00 | 32% of net sales, before rent, salaries and utilities |
Worked example from the table above. Your contract terms will differ.
We call that last line CM3: net payout minus food cost, as a share of net sales. It is the number we use to decide almost everything else, including whether a restaurant should spend another dirham on ads.
Interactive profit checkRun these numbers on your own salesThe calculator opens with this example filled in. Change the sliders to your commission, discounts and food cost and see what you keep each month.Discounts move the number more than commission
Now run the same order with a deeper offer. The commission rate stays at 25%, but the discount you fund goes from AED 10 to AED 30, and ad spend creeps up because the campaign needs visibility.
| Line | 10% offer | 30% offer |
|---|---|---|
| Net sales | 90.00 | 70.00 |
| Commission at 25% | −22.50 | −17.50 |
| App marketing | −4.00 | −6.00 |
| Adjustments | −1.50 | −1.50 |
| Net payout | 62.00 | 45.00 |
| Food and packaging | −33.00 | −33.00 |
| CM3 | 29.00 (32%) | 12.00 (17%) |
Commission actually went down in AED terms, and the restaurant still lost more than half its margin. The food did not get cheaper because the price did. This is the most common pattern we see in audits: a brand chasing order volume with offers, watching sales grow, and wondering why the bank balance does not.
Below 20% CM3, we do not add any new ad spend. Between 20% and 25%, we fix pricing and offers first. At 25% or more, with food cost under 30% and a rating of 4.3 or higher, paid visibility usually pays for itself.
What fixing it looked like for one brand
Three busy Pan-Asian kitchens in Dubai South had the problem this article describes. Orders were climbing, but a 41% food cost left CM3 at 14%, below our 20% floor. Every dirham of advertising would have lost money, so we did not spend any until the menu was fixed.
Food cost fell 10 points and discounts 7. That paid for 4 points of advertising and 13 more points of CM3. Client name withheld. Figures rounded.Gromad case study 03.
The levers were gram-level recipe costing, right-sized portions plated to still look generous, solo combos at a lower entry price, and a menu cut from 64 items to 41. Ads went live only once CM3 cleared 25%. Monthly sales then grew 21% in six months, paid for by the margin rather than by discounts.
Where the quiet leaks are
- Unmatched refunds. Orders refunded to the customer and charged back to you, often for issues that were not yours. Most can be disputed if someone checks each statement.
- Offers that never switched off. A launch offer from six months ago still running on one app.
- Commission on the wrong base. Charged on the full price when your contract says net, or the other way round.
- Ad spend with no ceiling. CPC campaigns that keep bidding on slow days when the kitchen has capacity but customers are not ordering.
- Food cost drift. Supplier prices go up, menu prices stay the same, and nobody updates the recipe cost sheet.
What to do this week
- Pull last month's statements from every app you are on.
- For each app, work out net payout as a share of net sales. If one app sits far below the others, that is where to look first.
- List every offer that is live today and who funds it.
- Update your food cost per item with this month's supplier prices.
- Calculate CM3. If it is under 20%, pause new ad spend until pricing and offers are fixed.
If that sounds like a long afternoon, it is. It is also the work we do every month for the brands we run, as part of the profit side of growth management. For which apps deserve your time in the first place, read Talabat, Deliveroo, Keeta, Noon or Careem.
Martha runs the Gromad product dashboard, from the data pipes to the numbers clients see each week. Happiest when a messy sales export reconciles to the last dirham.
More from Martha
 Mohammad Intekhab Alam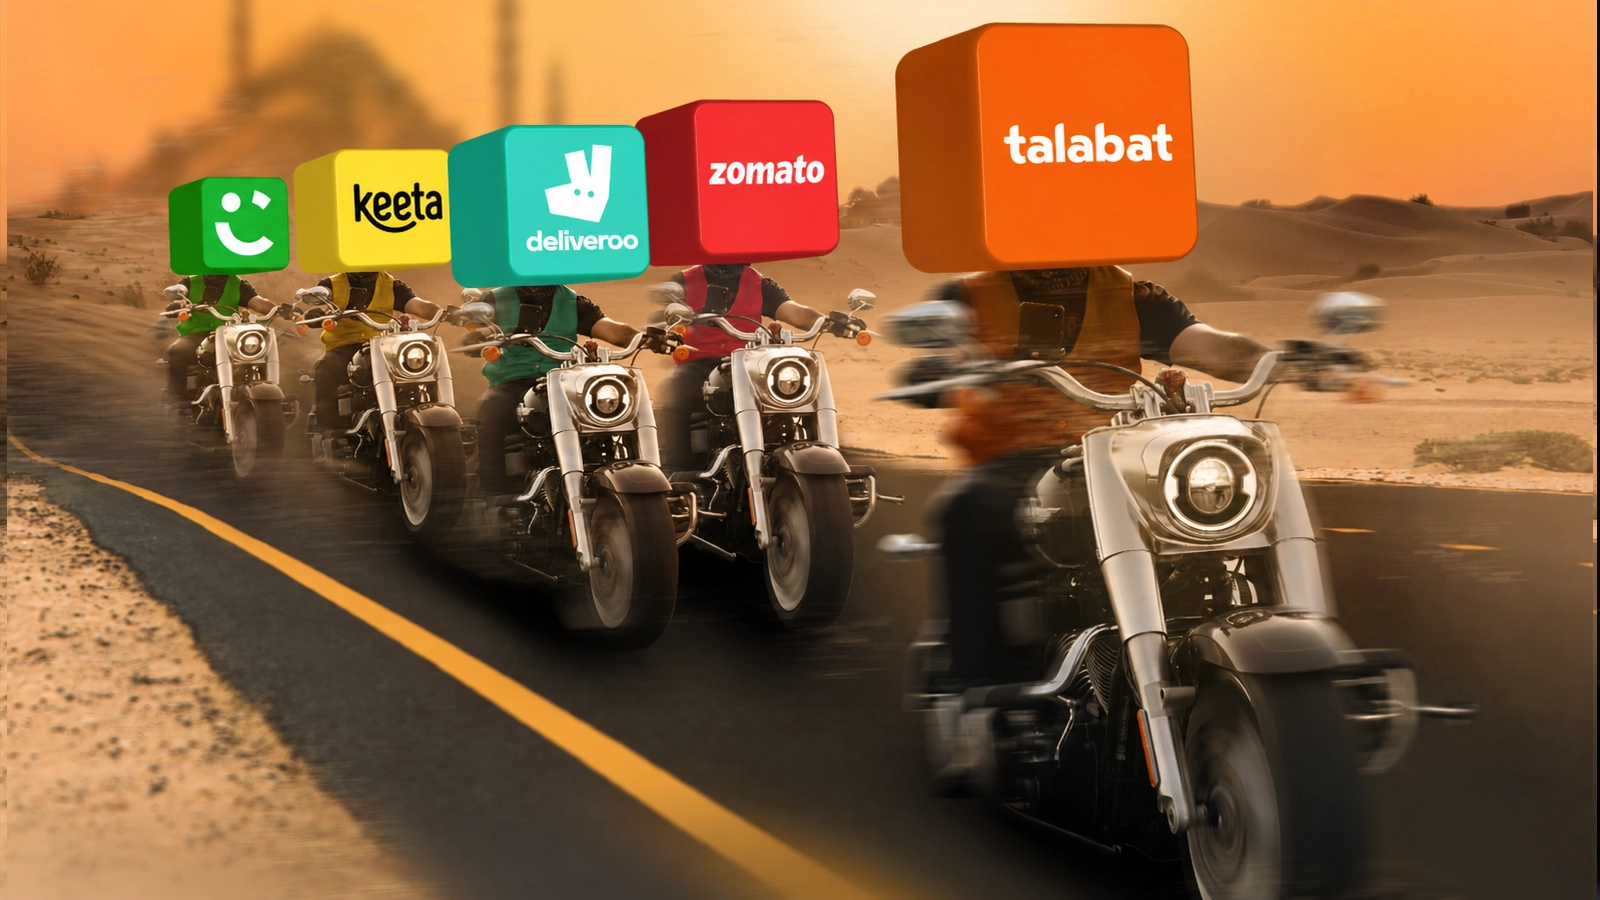
 Ryan Verghese
 Dilshad Raza